
TL;DR:
- Sales velocity measures how quickly revenue is generated from the pipeline by combining opportunities, deal value, win rate, and cycle length. Improving multiple components simultaneously can significantly accelerate revenue growth due to the multiplicative effect of the formula. Tracking this metric regularly and segmenting data helps identify bottlenecks and optimize sales processes effectively.
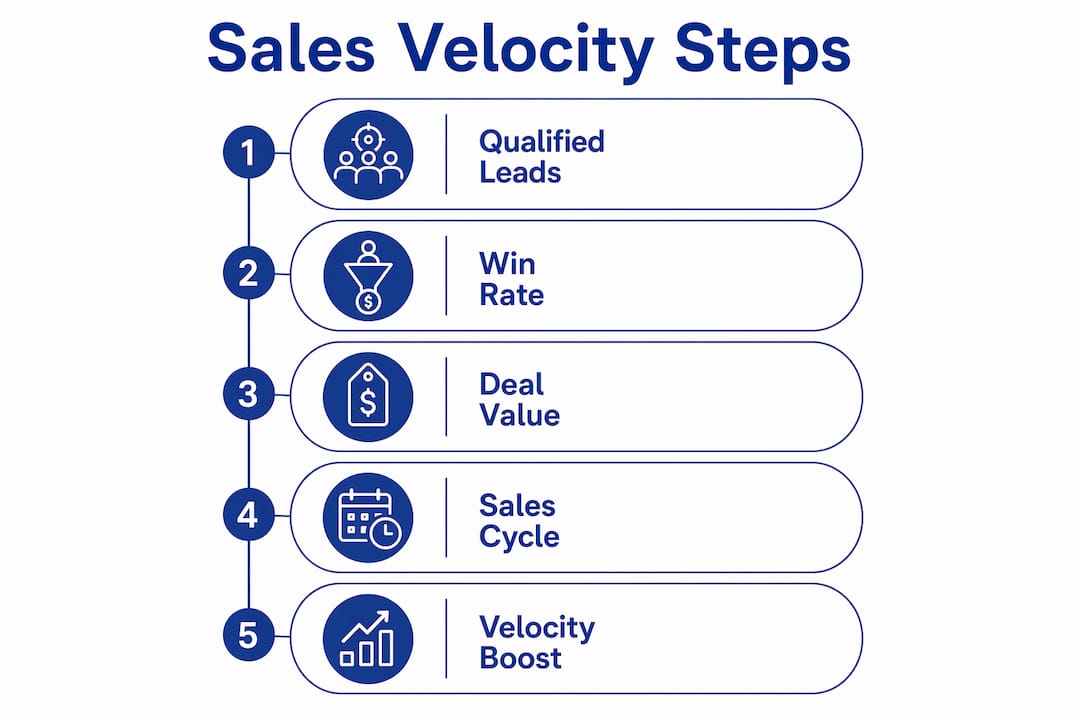
Sales velocity is defined as the rate at which your sales pipeline generates revenue, expressed as revenue per unit time. HubSpot and Zendesk both describe it as a direct reflection of sales productivity and process efficiency. The metric combines four components into a single formula: number of qualified opportunities, average deal value, win rate, and sales cycle length. Together, these inputs tell you not just how much you’re selling, but how fast you’re converting pipeline into cash. For sales professionals and business owners, understanding what is sales velocity means gaining a real-time diagnostic tool for revenue forecasting, team performance, and growth planning.
What is sales velocity and how does the formula work?
Sales velocity is calculated using one formula: (Number of Opportunities × Average Deal Value × Win Rate) ÷ Sales Cycle Length in Days. Monday.com, HubSpot, and Zendesk all validate this formula as the standard method for measuring revenue speed across B2B and B2C sales environments. The result tells you how many dollars your pipeline produces per day.
Here is how each component breaks down:
- Number of Opportunities: Count only qualified opportunities. Including unqualified leads inflates the numerator and distorts your result. Pull this figure from your CRM pipeline view, filtered by stage.
- Average Deal Value: The mean contract or order value across your active opportunities. Use closed-won data from the same period to keep this number grounded in reality.
- Win Rate: Expressed as a decimal. If you close 30 out of 100 opportunities, your win rate is 0.30. Zendesk defines win rate as sales won divided by total opportunities in the same measurement window.
- Sales Cycle Length: The average number of days from opportunity creation to close. Shorter is better because cycle length sits in the denominator. Cutting it directly increases velocity.
Example calculation: You have 50 qualified opportunities, an average deal value of $8,000, a win rate of 0.25, and a 40-day sales cycle. Your sales velocity = (50 × $8,000 × 0.25) ÷ 40 = $2,500 per day.
Pro Tip: Never mix data from different time windows. If your win rate is calculated over 90 days but your opportunity count reflects only the last 30 days, your velocity number will be misleading. Lock all four inputs to the same cohort period before running the formula.

Why sales velocity matters for revenue growth
Sales velocity is the clearest signal of how efficiently your sales process converts effort into money. A rising velocity number means your pipeline is healthy. A flat or falling number tells you something specific is broken, and the formula shows you exactly where to look.
The four-component structure makes velocity a diagnostic tool, not just a scorecard. Zendesk describes this as identifying which lever needs attention: opportunity volume, win rate, deal size, or cycle length. That precision separates sales velocity from blunt metrics like total revenue or quota attainment.
The business impacts are concrete:
- Revenue forecasting: Multiply your daily velocity by the number of selling days in a quarter to project revenue with confidence.
- Resource planning: A low velocity driven by a long sales cycle signals a need for process redesign or additional headcount, not more leads.
- Team benchmarking: Compare velocity across reps or territories to identify top performers and replicate their behaviors.
- Bottleneck detection: If win rate drops while opportunity volume rises, your qualification process is the problem, not your pipeline size.
“Because the sales velocity formula is multiplicative and divided by cycle time, improving multiple inputs simultaneously compounds growth far beyond what any single improvement achieves alone.” — HubSpot
That compounding effect is the real reason sales velocity deserves a permanent spot on your performance dashboard.
Sales velocity vs. pipeline velocity vs. lead velocity rate
These three terms create real confusion, even among experienced sales professionals. They measure related but distinct things. Understanding the differences helps you pick the right metric for each decision.
| Metric | What It Measures | Primary Use |
|---|---|---|
| Sales Velocity | Revenue generated per day from the full pipeline | Overall revenue speed and sales productivity |
| Pipeline Velocity | How fast deals move through each stage | Stage-level bottleneck identification |
| Lead Velocity Rate | Month-over-month growth in qualified leads | Leading indicator of future revenue |
| Deal Velocity | Time from opportunity creation to close for individual deals | Process efficiency per deal type |
Monday.com and Zendesk note that pipeline velocity and sales velocity are often used interchangeably, but the distinction matters in practice. Pipeline velocity focuses on stage-to-stage deal progress, making it useful for diagnosing where deals stall. Sales velocity focuses on the revenue outcome, making it useful for forecasting and performance management.
Lead velocity rate is a leading indicator. It tells you whether your top-of-funnel is growing fast enough to sustain future revenue targets. Sales velocity is a lagging indicator. It confirms what your pipeline already produced. Smart sales teams track both.
Deal velocity is the most granular of the four. It measures process efficiency at the individual deal level, which is useful for comparing enterprise deals against SMB deals within the same pipeline.
How to improve sales velocity: practical strategies
Improving your sales velocity means moving at least one of the four formula components in the right direction. The highest-impact approach is moving all four simultaneously, since the formula multiplies the numerator components before dividing by cycle length.
Increase qualified opportunity volume
More qualified opportunities directly raise the numerator. Focus lead generation on your ideal customer profile rather than broad outreach. Use intent data, account-based marketing, and referral programs to bring in prospects who are already in buying mode. Qualifying leads rigorously before they enter your pipeline keeps your win rate healthy as volume grows.
Raise average deal value
- Offer product bundles that solve multiple problems in one purchase.
- Use tiered pricing to make premium options feel accessible.
- Train reps to identify expansion opportunities within existing accounts.
- Anchor negotiations on value delivered, not on feature lists.
Improve win rate
Win rate is the lever most directly tied to sales skill and process quality. Better discovery calls, tighter qualification frameworks like MEDDIC or BANT, and multi-stakeholder engagement all move this number. Increasing opportunity volume without improving win rate can actually lower overall velocity. Volume and conversion must grow together.
Shorten the sales cycle
Reducing sales cycle length requires process redesign or additional resources. You cannot simply ask reps to move faster. Concrete tactics include:
- Removing unnecessary approval steps from your internal process.
- Providing buyers with self-service resources like ROI calculators and comparison guides.
- Using multi-touch engagement sequences to maintain momentum between meetings.
- Assigning a dedicated deal champion on the buyer’s side to accelerate internal consensus.
Pro Tip: Segment your velocity metrics by deal type and timeframe. An SMB deal closing in 14 days and an enterprise deal closing in 90 days should never share the same velocity calculation. Mixing them masks bottlenecks and produces averages that guide no one.
Tools and reporting for tracking sales velocity
Tracking sales velocity consistently requires a CRM that captures all four formula components in real time. Salesforce, HubSpot CRM, and Pipedrive each offer pipeline reporting features that can surface opportunity count, average deal size, win rate, and cycle length from a single dashboard.
The most common reporting mistake is inconsistency in definitions. Zendesk warns that mixing definitions or mismatched data ranges produces misleading velocity numbers. Decide once what counts as a qualified opportunity, what marks the start and end of the sales cycle, and how you calculate win rate. Document those definitions and apply them uniformly.
Reporting best practices worth building into your process:
- Track daily and monthly: Daily velocity catches sudden drops. Monthly velocity reveals trends.
- Segment by deal size: SMB, mid-market, and enterprise deals behave differently. Separate reporting prevents distortion.
- Use cohort analysis: Measure velocity for deals that entered the pipeline in the same period, not deals that closed in different windows.
- Visualize trends: A line chart of weekly velocity over 12 weeks shows momentum far better than a single snapshot number.
HubSpot recommends segmenting velocity by deal type and timeframe to avoid masking bottlenecks. That advice applies whether you run a 10-person sales team or a 200-person revenue organization. The principle scales.
Integrate your velocity dashboard with your sales forecasting model. When velocity rises, your forecast should reflect that acceleration. When it drops, your forecast needs a downward revision before the quarter ends, not after.
Key takeaways
Sales velocity is the single most complete metric for measuring how efficiently your pipeline converts qualified opportunities into revenue per day.
| Point | Details |
|---|---|
| Core formula | Multiply opportunities, deal value, and win rate, then divide by sales cycle length in days. |
| Compounding gains | Improving multiple formula components simultaneously produces outsized velocity growth. |
| Diagnostic power | Each formula component points to a specific bottleneck: volume, conversion, deal size, or cycle speed. |
| Consistent definitions | Lock all four inputs to the same cohort and time window to avoid distorted calculations. |
| Segmented reporting | Split velocity by deal type and timeframe to surface bottlenecks that averages hide. |
The lever most sales teams ignore
I’ve worked with sales teams that obsess over pipeline volume and almost nothing else. They add more leads, run more outreach sequences, and wonder why revenue growth stays flat. The formula explains it every time: volume without conversion is noise.
The lever most teams underinvest in is sales cycle length. It sits in the denominator, which means every day you shave off the cycle multiplies the effect of every other improvement you’ve made. A 10% reduction in cycle length produces a bigger velocity gain than a 10% increase in opportunity count, assuming everything else stays equal. Yet cycle length is also the hardest to move. HubSpot is direct about this: shortening the cycle requires process redesign, new playbooks, or headcount. You cannot willpower your way to a faster close.
My honest recommendation is to start with a segmented velocity audit. Break your pipeline into SMB, mid-market, and enterprise cohorts. Calculate velocity separately for each. You will almost always find that one segment is dragging the average down while another is performing well. That insight tells you exactly where to focus your process improvement energy, rather than applying generic fixes across the board.
Modern buyers, especially in B2B, involve more stakeholders in purchase decisions than they did five years ago. That consensus-driven behavior extends cycle length by default. The teams winning on velocity in 2026 are the ones who map the buyer’s internal approval process early and assign resources to accelerate it, not just the seller’s side of the deal.
Measure consistently, segment deliberately, and improve iteratively. That is the formula for sustainable velocity growth.
— Goga
How Searchoneers helps you build sales velocity on amazon
If you sell on Amazon, your sales velocity is directly tied to how well your listings convert qualified traffic into purchases. A listing that ranks but does not convert is the Amazon equivalent of a long sales cycle with a low win rate.

Searchoneers specializes in Amazon listing enhancement that targets every velocity lever: more qualified traffic through keyword-optimized titles and backend terms, higher conversion rates through compelling bullet points and descriptions, and faster purchase decisions through clear, trust-building content. The team at Searchoneers also provides data-driven listing optimization that tracks performance metrics and adjusts strategy as the marketplace evolves. If you want to increase your Amazon sales velocity in 2026, the place to start is your listing quality.
FAQ
What is the sales velocity formula?
Sales velocity equals the number of qualified opportunities multiplied by average deal value and win rate, then divided by sales cycle length in days. The result represents revenue generated per day from your pipeline.
How is sales velocity different from pipeline velocity?
Sales velocity measures overall revenue speed from the full pipeline, while pipeline velocity tracks how fast deals move through individual stages. Both are useful, but they answer different questions.
What is a good sales velocity number?
There is no universal benchmark. A strong sales velocity number is one that trends upward over time within your specific market, deal type, and business model. Segment by deal size and compare period over period.
What affects sales velocity the most?
Sales cycle length has the highest leverage because it sits in the denominator of the formula. Reducing cycle length amplifies the effect of every other improvement across opportunity volume, deal size, and win rate.
How often should you track sales velocity?
Track sales velocity daily to catch sudden drops and monthly to identify trends. Segment by deal type and cohort period to avoid averages that mask real performance issues.
Leave a Reply