
TL;DR:
- Data analytics helps organizations make evidence-based decisions by uncovering patterns in raw data. It offers benefits like faster decision-making, cost savings, improved customer insights, and early risk detection. The key to success lies in focusing on quality data and aligning analytics with specific strategic objectives.
Data analytics is defined as the process of examining raw data to uncover patterns, draw conclusions, and guide business decisions with evidence rather than instinct. The advantages of data analytics extend far beyond basic reporting. They include faster decisions, lower costs, stronger customer relationships, and early warning systems for risk. 80% of organizations investing in analytics see measurable improvements in decision-making and operational efficiency. That number signals a clear competitive divide between businesses that use data and those that still rely on gut feel. Tools like Microsoft Power BI and Tableau have made these capabilities accessible to companies of every size, not just enterprise giants.
What are the core advantages of data analytics in business?
Data analytics, also called business intelligence or data-driven decision making in formal strategy contexts, converts raw numbers into specific, usable insights. The benefits of data analysis show up across every department, from finance to marketing to operations.
The most direct advantage is speed. When your decisions are grounded in real data, you cut the back-and-forth that slows teams down. You stop debating opinions and start acting on evidence.
Here is what the research confirms:
- Better revenue: 54% of analytics adopters report measurable revenue improvements after implementing data programs.
- Higher productivity: 64% of organizations report enhanced productivity once analytics is embedded in daily workflows.
- Stronger competitive positioning: 44% report a measurable competitive advantage over peers who do not use analytics.
- Process efficiency: Businesses analyzing data report 47% internal process efficiency gains versus just 14% for non-analytical peers.
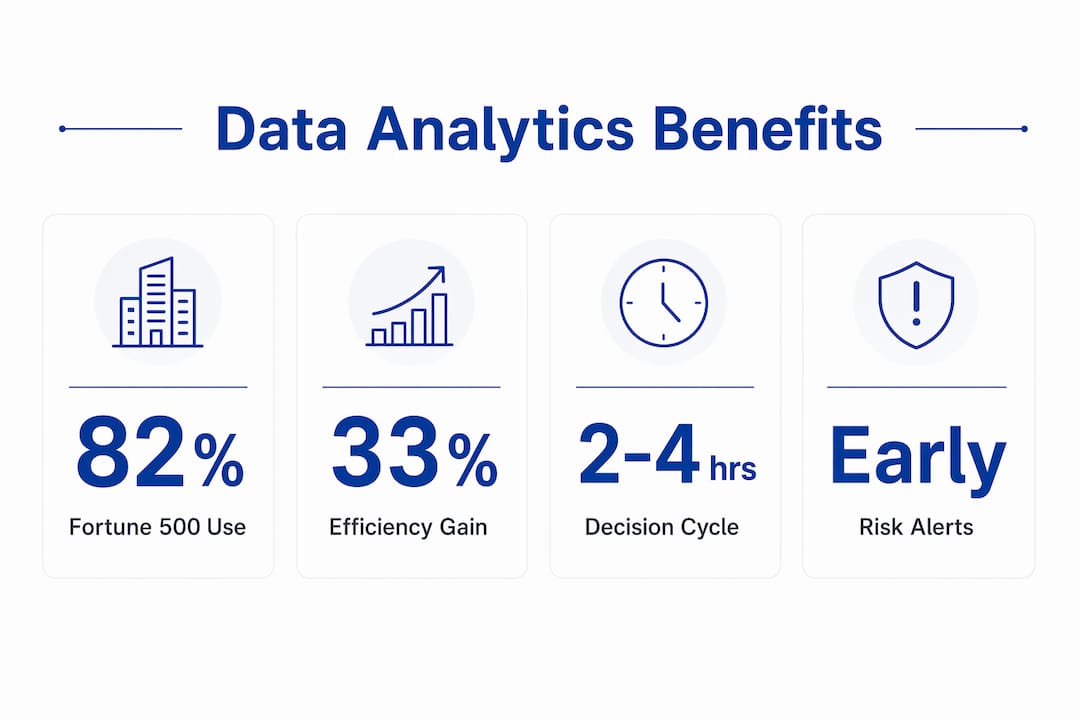
These are not marginal gains. A 33-percentage-point gap in process efficiency between data-driven and non-data-driven businesses is the kind of difference that determines market leaders.
Pro Tip: Start with one business question you cannot currently answer with confidence. Build your first analytics use case around that question. Solving a real, felt problem generates faster buy-in than deploying a broad analytics platform with no clear purpose.
How does data analytics improve decision-making?
Over 82% of Fortune 500 companies use data analytics as a core decision-making tool. That adoption rate reflects a fundamental shift: predictive models now replace executive bias in high-stakes choices.
Replacing guesswork with evidence
Traditional decisions rely on experience, hierarchy, and instinct. All three carry blind spots. A pricing decision based on a manager’s memory of last quarter is slower and less accurate than one built on real-time demand signals, competitor pricing data, and customer behavior patterns.
Predictive analytics tools like IBM Watson Studio and Google BigQuery process thousands of variables simultaneously. They surface correlations a human analyst would miss in weeks of manual work. The result is faster, more accurate choices on pricing, inventory, hiring, and market entry.
Strategic forecasting and market positioning
Data analytics advantages for businesses extend into long-range strategy. Retailers use transaction data to forecast seasonal demand 90 days out. Financial services firms model credit risk across millions of customer profiles. Manufacturers predict equipment failure before it disrupts production.
The shift from reactive to predictive data use replaces bias with evidence and reduces costly undetected errors. That shift is not a technology upgrade. It is a change in how leadership thinks about uncertainty.
Pro Tip: Prioritize data quality over sheer volume. A smaller, clean, well-governed dataset produces better decisions than a massive data lake full of inconsistent records. Targeted live signals often deliver better ROI than storing everything.
How does data analytics drive operational efficiency?
Operational efficiency is where the data analytics impact becomes most visible on a balance sheet. Real-time analytics reduce the time between insight and action from days to hours or even seconds. That compression directly accelerates workflows and reduces waste.

Supply chain and procurement are the clearest examples. Data-driven analysis of supplier performance, lead times, and demand patterns yields 10–25% cost savings in procurement. For a business spending $5 million annually on supply chain operations, that is $500,000 to $1.25 million recovered without cutting headcount.
The table below shows typical efficiency outcomes before and after analytics implementation:
| Metric | Before Analytics | After Analytics |
|---|---|---|
| Decision cycle time | 3–5 days | 2–4 hours |
| Supply chain cost variance | 15–20% over budget | 5–8% over budget |
| Inventory overstock rate | 18–25% | 6–10% |
| Process bottleneck detection | Weeks (manual audit) | Hours (automated alert) |
| Employee productivity score | Baseline | 64% report measurable gains |
Streaming analytics, which process data continuously rather than in scheduled batches, are the engine behind these gains. Traditional batch processing delivers insights after the fact. Streaming tools like Apache Kafka and Amazon Kinesis deliver insights as events happen. That difference matters when you are managing a warehouse, a call center, or a live ad campaign.
Pro Tip: Map your three most time-consuming manual reporting tasks before choosing an analytics platform. The right tool eliminates those tasks first. Efficiency gains from automation compound quickly once you remove the biggest friction points.
How can analytics deepen customer insights?
Customer understanding is one of the most powerful benefits of big data analytics. Data analytics enables 360-degree customer views by integrating demographics, purchase behavior, browsing patterns, and channel preferences into a single profile. That profile is far more accurate than anything a periodic survey can produce.
Here is a practical process for using analytics to sharpen your customer experience strategy:
- Consolidate your data sources. Pull together your CRM, website analytics, email platform, and transaction history into one unified view. Tools like Salesforce, HubSpot, and Segment make this integration manageable for mid-size businesses.
- Identify your highest-value segments. Use cohort analysis to find which customer groups generate the most revenue, the highest repeat purchase rates, and the lowest churn. These are your priority segments for personalization.
- Predict churn before it happens. Build or buy a churn prediction model that flags customers showing disengagement signals, such as declining purchase frequency or reduced email opens. Act on those signals with targeted retention offers before the customer leaves.
- Test and personalize at scale. Use A/B testing platforms like Optimizely or VWO to run personalization experiments. Let the data tell you which messages, offers, and product recommendations convert best for each segment.
- Move beyond surveys to behavioral data. Real-time behavioral data reveals what customers actually do, not just what they say they prefer. That distinction drives loyalty programs that work.
Analytics also surfaces underserved segments. A retailer analyzing purchase data might discover a cluster of customers buying products in combinations the marketing team never targeted. That discovery becomes a new campaign, a new bundle, or even a new product line.
How does data analytics reduce risk and fuel innovation?
Risk mitigation is one of the most underrated advantages of big data analytics. Predictive models identify equipment failures, supply disruptions, and fraud patterns before they escalate into crises. That early warning capability changes the economics of risk management.
Industry use cases worth knowing
In financial services, banks use transaction analytics to flag fraud in milliseconds. JPMorgan Chase processes billions of transactions annually and uses machine learning models to catch anomalies that rule-based systems miss entirely.
In healthcare, predictive analytics tools analyze patient data to flag readmission risk, enabling hospitals to intervene before costly complications occur. This reduces both patient harm and operational cost.
In retail, inventory analytics prevent stockouts during peak demand periods. A missed sale during a holiday weekend is not just lost revenue. It is a customer who may not return.
Data-driven innovation also creates new product and market opportunities. Analyzing customer behavior and transaction data reveals unmet needs that internal teams would never identify through brainstorming alone.
Key risk mitigation benefits that analytics delivers:
- Early fraud detection across financial transactions and account activity
- Predictive maintenance alerts that prevent equipment downtime
- Supply chain disruption signals that trigger contingency sourcing
- Regulatory compliance monitoring that catches violations before audits
- Credit risk scoring that reduces default rates in lending portfolios
Raw data is low value until it is transformed with analytics aligned to specific strategic objectives. The businesses winning on risk and innovation are not those with the most data. They are the ones asking the sharpest questions of their data.
Key takeaways
Data analytics delivers its greatest value when businesses align it directly with specific operational and strategic objectives rather than collecting data for its own sake.
| Point | Details |
|---|---|
| Decision quality improves fast | 82% of Fortune 500 firms use analytics to replace guesswork with evidence-based choices. |
| Operational savings are measurable | Supply chain analytics alone yields 10–25% cost reductions in procurement spending. |
| Customer insight drives loyalty | 360-degree customer profiles built from behavioral data predict churn and reveal new segments. |
| Risk detection becomes proactive | Predictive models flag fraud, equipment failure, and supply disruption before they become crises. |
| Data quality beats data volume | Governed, targeted datasets produce better decisions than unmanaged data lakes. |
Why most businesses still get analytics wrong
I have worked with enough businesses to say this plainly: the biggest analytics failure is not a technology problem. It is a focus problem.
Teams collect enormous amounts of data, deploy expensive platforms, and then spend months building dashboards nobody uses. The reports look impressive. The decisions do not improve. That is paralysis by analysis, and it is more common than any vendor will tell you.
The businesses that actually benefit from analytics do one thing differently. They start with a decision, not a dataset. They ask, “What do we need to know to make this specific call better?” and then they build backward from that question to the data they need.
I have also seen the opposite failure: under-investment in data governance. A company runs its analytics on inconsistent, duplicate, or outdated records and then wonders why the model keeps producing nonsense. Quality and governance are more critical than volume. That is not a popular message when everyone is talking about big data, but it is the truth.
The businesses I respect most treat analytics as an ongoing discipline, not a one-time project. They review their data sources quarterly, retire metrics that no longer reflect business reality, and keep their analytics tightly connected to the decisions that actually move revenue. That discipline is what separates companies that talk about being data-driven from the ones that actually are.
— Goga
How Searchoneers turns analytics into sales growth
Understanding the importance of data analytics is one thing. Putting it to work in a competitive marketplace is another. Searchoneers specializes in exactly that connection, translating data signals into listing performance, search visibility, and sales growth for Amazon sellers.

Whether you are just starting to monitor Amazon analytics or ready to build a full data-driven listing strategy, Searchoneers has the frameworks to get you there. Our Amazon SEO optimization approach is built on the same evidence-based principles covered in this article: clean data, sharp questions, and decisions tied directly to revenue outcomes. If you want to see how analytics translates into real sales results, explore our Amazon analytics sales growth guide and start making your data work harder.
FAQ
What are the main advantages of data analytics for businesses?
Data analytics improves decision quality, reduces operational costs, deepens customer understanding, and enables early risk detection. Research shows 80% of organizations that invest in analytics see measurable gains in efficiency and revenue.
How does data analytics improve decision-making?
Analytics replaces intuition with evidence by processing large datasets to surface patterns and predictions. Over 82% of Fortune 500 companies use it as a core decision-making tool to reduce reliance on guesswork.
What is the difference between data analytics and big data analytics?
Data analytics refers broadly to examining datasets to draw conclusions. Big data analytics specifically handles extremely large, high-velocity datasets using distributed systems like Apache Hadoop or Google BigQuery to find patterns at scale.
How quickly can a business see results from data analytics?
Real-time analytics tools reduce decision latency from days to hours, meaning operational improvements can appear within weeks of implementation. Supply chain cost savings of 10–25% are typically measurable within one to two quarters.
Why is data quality more important than data volume?
Flawed or inconsistent data produces inaccurate models and poor decisions regardless of dataset size. Governed, targeted datasets consistently outperform large unmanaged data lakes in both accuracy and ROI.
Leave a Reply