
TL;DR:
- Click through rate measures the percentage of people who click on a link after seeing it, indicating content relevance.
- However, interpreting CTR requires contextual understanding across channels, campaign types, and aligning it with conversion data to assess true effectiveness.
Click through rate is one of the most cited metrics in digital marketing and one of the most misunderstood. Marketers obsess over it, optimize for it, and sometimes make budget decisions based on it alone. But what is click through rate really telling you? The click through rate definition is straightforward: it measures the percentage of people who clicked on a link after seeing it. What gets complicated is interpreting that number correctly across channels, campaign types, and business goals. This guide breaks down the formula, the benchmarks, the misconceptions, and the strategies that actually move the needle.
Table of Contents
- Key takeaways
- What is click through rate: definition, formula, and core concepts
- CTR benchmarks by platform in 2026
- CTR misconceptions: what high or low CTR actually means
- How to calculate click through rate and read the data correctly
- Strategies to improve click through rate
- My honest take on CTR as a performance metric
- Ready to turn clicks into customers?
- FAQ
Key takeaways
| Point | Details |
|---|---|
| CTR formula is simple | Divide total clicks by total impressions, then multiply by 100 to get your percentage. |
| Benchmarks vary widely | Google Search Ads average 3–8% CTR, while Display Ads average just 0.1–0.5%. |
| High CTR can mislead | A high click volume with poor intent alignment produces low conversions, not revenue. |
| Segmentation beats averages | Aggregate CTR hides which queries, creatives, or audiences are actually performing. |
| CTR needs a partner metric | Pair CTR with conversion rate and attribution data to measure true campaign effectiveness. |
What is click through rate: definition, formula, and core concepts
The click through rate meaning, at its core, is simple. CTR tells you what percentage of the people who saw your ad, email, or listing actually clicked on it. It is a direct signal of how relevant and appealing your content is to the audience seeing it.
The CTR formula is:
(Total Clicks ÷ Total Impressions) × 100 = CTR%
So if your ad received 500 clicks from 20,000 impressions, your CTR is 2.5%. You can also rearrange the formula. If you know your CTR and impressions, you can calculate expected clicks. If you know clicks and CTR, you can back-calculate impressions. This flexibility makes CTR a useful planning tool, not just a reporting number.
Now, CTR is not a one-size-fits-all metric. It looks different depending on where you measure it:
- Search ads: CTR measures clicks relative to the number of times your ad appeared in search results.
- Display and social ads: CTR is clicks against total ad impressions served across the network.
- Email marketing: This is where it gets nuanced. There is a critical distinction between click rate and click through rate in email. Click rate vs. CTR are not interchangeable. Click rate measures clicks from total recipients sent. CTR in email measures unique clicks divided by unique opens, meaning it tracks engagement from people who actually saw your message. The email CTR benchmark sits at roughly 10–20% depending on your industry.
- Organic search (SEO): CTR reflects how many users clicked your page link after seeing it in Google’s results.
Understanding which version of CTR applies to your channel matters before you start any optimization work.
Pro Tip: In email platforms like Klaviyo, always check whether you are viewing click rate or click-through rate. Holistic CTR counts repeated clicks from the same user, which can inflate your number and lead to misleading CTR decisions compared to unique CTR.
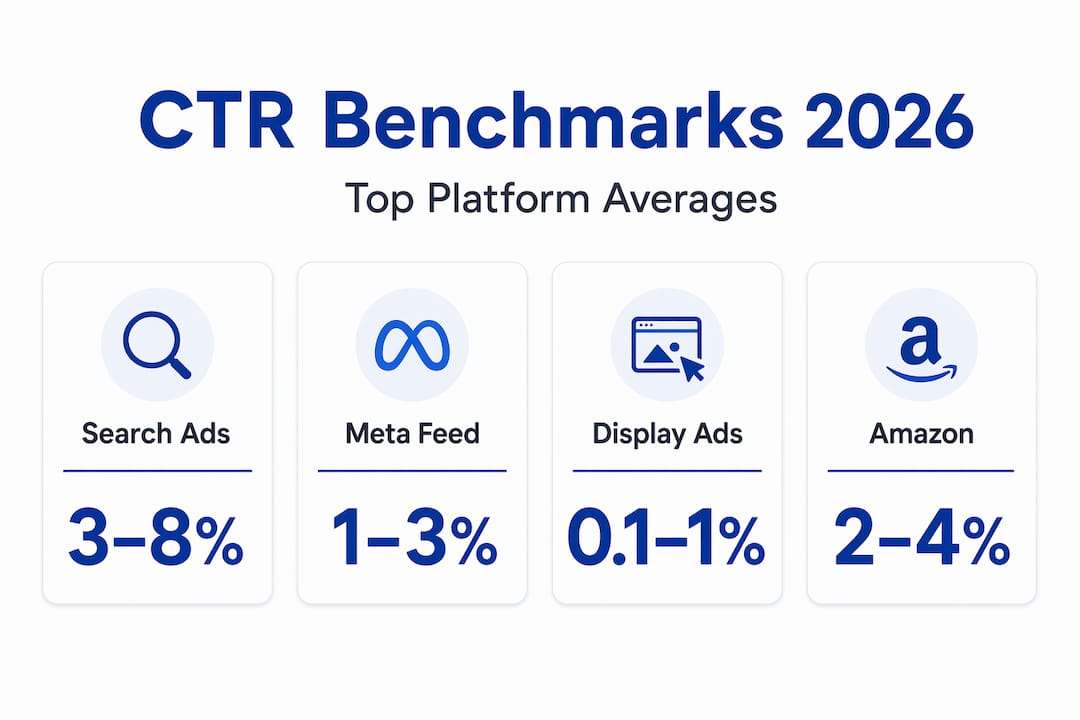
CTR benchmarks by platform in 2026
Context transforms a CTR number from abstract to meaningful. A 2% CTR could be excellent for display advertising and terrible for a Google Search campaign. Knowing where your number lands relative to your channel’s norm is what gives you direction.

Here is a snapshot of 2026 CTR benchmarks across key digital channels:
| Channel | Typical CTR range | Notes |
|---|---|---|
| Google Search Ads | 3–8% | Higher intent; strong copy drives the upper range |
| Meta Feed Ads | 1–3% | Audience precision and creative quality are key drivers |
| LinkedIn Ads | 0.3–0.8% | Lower volume but often higher quality B2B leads |
| Display Ads | 0.1–0.5% | Banner blindness is a major challenge in this format |
| Email CTR | 10–20% | Measured against unique opens, varies heavily by industry |
| YouTube | 4–10% | Niche channels sometimes exceed 15% CTR |
A few things stand out in these numbers. LinkedIn’s range looks low, but a 0.5% CTR on a campaign targeting CFOs at Fortune 500 companies may outperform a 5% CTR on a broad consumer campaign. YouTube is particularly interesting. High-volume channels with millions of subscribers often see lower CTR precisely because they attract casual browsers. Niche channels with tight audiences see high CTR because every thumbnail is built for a specific viewer who is already engaged.
Why is click through rate important as a benchmark tool? Because it lets you detect problems early. If your Google Search CTR drops below 2% on branded keywords, something is off with your copy or a competitor has started bidding aggressively on your terms. Benchmarks give you a threshold to investigate, not just a number to report.
CTR misconceptions: what high or low CTR actually means
Here is the trap most marketers fall into. You run a campaign, see a 6% CTR, and feel good about it. But six weeks later, conversions are flat. What happened?
High CTR does not guarantee high ROI. An ad that promises a massive discount or uses sensational copy can generate clicks from people who have no real intent to buy. You get the traffic, you pay for the clicks, and you convert almost none of them. The issue is intent alignment, not click volume.
On the flip side, a low CTR is not always a red flag. Some campaigns are built for brand awareness. If you’re running a display campaign to introduce your product to a cold audience, a 0.2% CTR alongside a measurable lift in branded search queries is a legitimate outcome. CTR paired with conversion and attribution data gives you the full picture. CTR alone gives you a sliver of it.
Common causes of genuinely low CTR worth fixing:
- Banner blindness: Repeated exposure to the same creative causes users to tune it out. Frequency caps and creative rotation are the fix.
- Irrelevant targeting: Your ad is reaching the wrong people. No amount of great copy overcomes a mismatched audience.
- Weak benefit messaging: Ads that describe features instead of outcomes get ignored. “Waterproof hiking boots” is weaker than “Stay dry on any trail, guaranteed.”
- Poor placement timing: Serving ads at low-intent moments, like early morning mobile browsing, suppresses CTR regardless of creative quality.
A 2% CTR from your ideal buyer is worth more than a 10% CTR from a scattered audience. Click volume is vanity. Intent-matched clicks are currency.
Pro Tip: Segment your CTR by audience, device, and time of day before drawing conclusions from aggregate numbers. Aggregate CTR can mask a handful of top-performing queries inflating your overall average while dozens of long-tail terms underperform silently.
How to calculate click through rate and read the data correctly
Calculating CTR is the easy part. Reading it correctly is where most marketers lose time and money.
Here is a step-by-step approach to calculating and interpreting your CTR data:
- Pull your raw data. From your platform (Google Ads, Meta Ads Manager, your email tool), export clicks and impressions for the period you are analyzing.
- Apply the formula. Divide total clicks by total impressions, then multiply by 100. If you received 1,200 clicks from 40,000 impressions, your CTR is 3%.
- Distinguish unique from total clicks. In email specifically, total clicks count every click including repeat visits from the same person. Unique clicks count each person once. Always clarify which number your platform is reporting.
- Segment before you interpret. Break your CTR down by campaign, ad set, keyword, or audience segment. A 3% average often hides a 7% segment and a 0.8% segment sitting side by side.
- Compare to the right benchmark. Match your CTR to the correct channel and industry norm. Do not compare your LinkedIn B2B CTR to your Google Search CTR.
- Pair with conversion rate. CTR tells you attraction. Conversion rate tells you relevance and landing page quality. Neither metric is complete without the other.
Useful platforms for tracking CTR include Google Ads, Google Search Console (for organic CTR by query), Meta Ads Manager, and Klaviyo or Mailchimp for email. Each platform calculates slightly differently, so always read their documentation on how clicks and impressions are defined before comparing cross-platform numbers.
Pro Tip: Google Search Console is underused for CTR analysis. Filter by query, then sort by impressions descending. You will quickly find high-impression, low-CTR queries where a stronger title tag or meta description could capture significantly more traffic at zero extra cost.
Strategies to improve click through rate
Improving your CTR is not about one magic tactic. It is a systematic process of testing, segmenting, and refining. Here is where to focus your energy:
Write headlines that lead with outcomes. Your ad headline or email subject line is the single biggest CTR lever you have. “Save 30% on Your Next Order” outperforms “Shop Our Summer Sale” every time. Specificity signals relevance. Relevance drives clicks.
Test video against static images. Switching creative formats, particularly moving from static images to short video, consistently lifts CTR on social platforms. Video creates motion in a static feed, which captures attention before a user can scroll past. This is one of the most overlooked improvements in standard A/B testing routines.
Additional tactics that produce real results:
- Sharpen your audience targeting. The tighter your audience definition, the more relevant your ad feels to every person seeing it. Broader audiences suppress CTR even with strong creative.
- Apply frequency caps. On display and social, uncapped frequency is one of the fastest paths to banner blindness. A user who has seen your ad eight times this week is not clicking on the ninth impression. Cap frequency and rotate creatives every two to three weeks.
- Use direct, benefit-led calls to action. “Get My Free Guide” outperforms “Download Now.” Personalized and specific CTAs tell the user exactly what they gain by clicking.
- Optimize for mobile. Mobile users now represent the majority of ad impressions on social platforms. If your creative is not designed for a 6-inch screen, your CTR will reflect that.
- Refresh creatives regularly. Ad fatigue is real and measurable. If your CTR trends downward week-over-week with no change in targeting, your creative is wearing out. Build a rotation schedule.
For Amazon sellers, improving your listing’s CTR starts with your main image and title. These are your “ad” in the search results. Optimized titles and compelling imagery directly affect how many shoppers click through to your product detail page. You can explore practical steps for this through Searchoneers’ guide on Amazon listing CTR.
Pro Tip: Run headline tests in pairs, not multiples. Testing three or more variations at once makes it harder to isolate what actually moved the needle. Test two, pick a winner, then test the winner against a new challenger. Slow and systematic beats fast and chaotic.
My honest take on CTR as a performance metric
I have watched teams burn significant budget chasing CTR improvements that did nothing for revenue. The number goes up, everyone celebrates, and then the conversion data comes in flat. It is frustrating to diagnose because the campaign looks like it is working.
In my experience, the mistake is almost always the same. Marketers treat CTR as a goal rather than a signal. CTR is a directional indicator. It tells you whether your message is connecting with the right people at the right moment. It does not tell you whether those people are actually ready to buy.
What I have found actually works is building a simple two-metric check before drawing any conclusions: CTR and post-click conversion rate together. If both are low, the problem is targeting and creative. If CTR is high but conversion is low, the landing page or offer is misaligned with what the ad promised. If CTR is low but conversion is high, you have a messaging problem, not an audience problem.
I am also skeptical of any optimization decision made on aggregate CTR data. Segmentation consistently reveals surprising pockets of performance. I have seen single queries driving a 26% CTR while the overall account average sat at 3%. That gap is invisible unless you look at CTR data by segment. Averages lie. Segments tell the truth.
CTR matters. Do not dismiss it. But treat it as one instrument in a larger dashboard, not the whole performance story.
— Goga
Ready to turn clicks into customers?
If understanding CTR has made you realize your product listings or ads are leaving clicks on the table, you are not alone. Most e-commerce sellers underestimate how much their title, image, and copy directly control whether a shopper clicks or scrolls past.

At Searchoneers, we specialize in Amazon listing optimization built around real performance data, not guesswork. From title structure to backend keywords, every element is crafted to increase visibility and clicks. Whether you are starting from scratch or auditing an existing catalog, the Amazon listing enhancement guide from Searchoneers gives you a clear, step-by-step path to listings that perform. You can also check out our listing optimization workflow for a repeatable process that scales as your product line grows.
FAQ
What is the click through rate formula?
CTR is calculated by dividing total clicks by total impressions, then multiplying by 100. For example, 300 clicks from 10,000 impressions equals a 3% CTR.
What is a good click through rate in 2026?
It depends on the channel. Google Search Ads average 3–8%, Meta Feed Ads average 1–3%, and Display Ads average just 0.1–0.5%. Compare your CTR to your specific platform benchmark, not a universal standard.
Why is click through rate important for e-commerce sellers?
CTR directly affects how much traffic reaches your product page or ad landing page. On Amazon, a low CTR means fewer shoppers ever see your offer, which limits sales regardless of how strong your conversion rate is.
What affects click through rate the most?
The biggest factors are headline or title quality, audience targeting precision, creative format, and frequency of ad exposure. Weak benefit messaging and mismatched audiences are the top two causes of low CTR.
Does a high CTR always mean a successful campaign?
No. High CTR with poor intent alignment produces clicks without conversions. A campaign succeeds when CTR is paired with strong post-click conversion rates and aligned with your revenue goals.