

TL;DR:
- Amazon’s customer base is mainly adults aged 25 to 54, with high-income households showing the strongest Prime membership. Sellers must differentiate messaging for Prime loyalists and deal seekers, as each segment has distinct motivations and behaviors. Using Amazon data for targeted listing and advertising strategies increases sales efficiency and long-term customer value.
Amazon’s target market is defined as the global base of over 310 million active customer accounts shaped by distinct demographic, behavioral, and economic profiles that drive purchasing decisions across every product category. For e-commerce sellers and marketers, understanding this base is not optional. It is the foundation of every listing, ad campaign, and pricing decision that determines whether a product sells or sits. Amazon’s shoppers span millennials chasing convenience, deal seekers hunting discounts, and Prime loyalists who pay for speed and service. Each group responds to different messaging, different price points, and different product presentations. Knowing which segment you are targeting changes everything about how you compete.
What are the primary demographic segments within Amazon’s target market?
Amazon’s customer base skews toward adults aged 25–54, with millennials forming the largest and most active buying group. This age range represents the sweet spot where digital fluency meets real purchasing power. Sellers who build listings and ads around this core group capture the majority of high-frequency transactions.
Income plays a defining role in segment behavior. Prime membership exceeds 200 million globally, with U.S. penetration surpassing 70% among households earning above $100,000 annually. That means your highest-value customers are disproportionately affluent. They are not shopping primarily on price. They are shopping on trust, speed, and product quality.
Key demographic characteristics of Amazon shoppers include:
- Age: Core buyers fall in the 25–54 range, with millennials (ages 28–43) driving the highest purchase frequency.
- Income: Higher-income households dominate Prime membership and repeat purchases.
- Gender: Amazon’s customer base is roughly balanced between men and women, with category preferences varying significantly by gender.
- Geography: The U.S. accounts for approximately 82% of active accounts, totaling around 255 million users. Urban and suburban households represent the densest concentration of buyers.
- Household type: Families with children are heavy users of subscription programs like Subscribe & Save, generating higher lifetime value than single-person households.
Geographic concentration matters for sellers choosing which markets to prioritize. The U.S. market dominates volume, but international expansion into the U.K., Germany, Japan, and India is accelerating. Each market carries its own demographic profile and device preference, which directly affects how you structure your listings and ad spend.
How does Amazon segment its market behaviorally and psychographically?
Behavioral segmentation on Amazon goes far deeper than age and income. Mintel’s retail research identifies distinct tech adoption segments among Amazon shoppers, splitting them broadly into tech-forward early adopters and more traditional buyers who move slowly toward new features. This distinction shapes which product categories each group favors and how they respond to new Amazon features like Alexa integration or one-click purchasing.

The most commercially significant behavioral divide is between Prime loyalists and deal seekers. Prime loyalists make up about 39% of Amazon shoppers, skew younger and higher income, and prioritize convenience and service over the lowest possible price. Deal seekers, by contrast, are price-driven and will switch products or delay purchases for a better offer. Confusing these two groups leads to pricing strategies that undercut your margins without winning the right customers.
| Segment | Primary motivation | Price sensitivity | Best marketing approach |
|---|---|---|---|
| Prime loyalists | Convenience and speed | Low | Emphasize fast shipping, brand trust, and quality |
| Deal seekers | Lowest price | High | Promotions, coupons, and Lightning Deals |
| Tech-forward adopters | New features and innovation | Medium | Highlight product specs and cutting-edge functionality |
| Traditional shoppers | Familiarity and reliability | Medium | Clear descriptions, strong reviews, and simple navigation |
| Subscribe & Save users | Recurring convenience | Low to medium | Bundle offers and subscription discounts |
Psychographic traits also shape category preferences. Tech-forward shoppers over-index on electronics and smart home devices. Families with children dominate Subscribe & Save recurring purchases, prioritizing household staples and baby products. Understanding these psychographic drivers lets you write product copy that speaks directly to the motivation behind the purchase, not just the product feature.
Pro Tip: Write two versions of your key bullet points: one for Prime loyalists (emphasize speed, quality, and brand) and one for deal seekers (emphasize value, savings, and comparison). Test both with Amazon’s A/B testing tools to see which drives higher conversion for your category.
What are the key buying behaviors and product category preferences on Amazon?
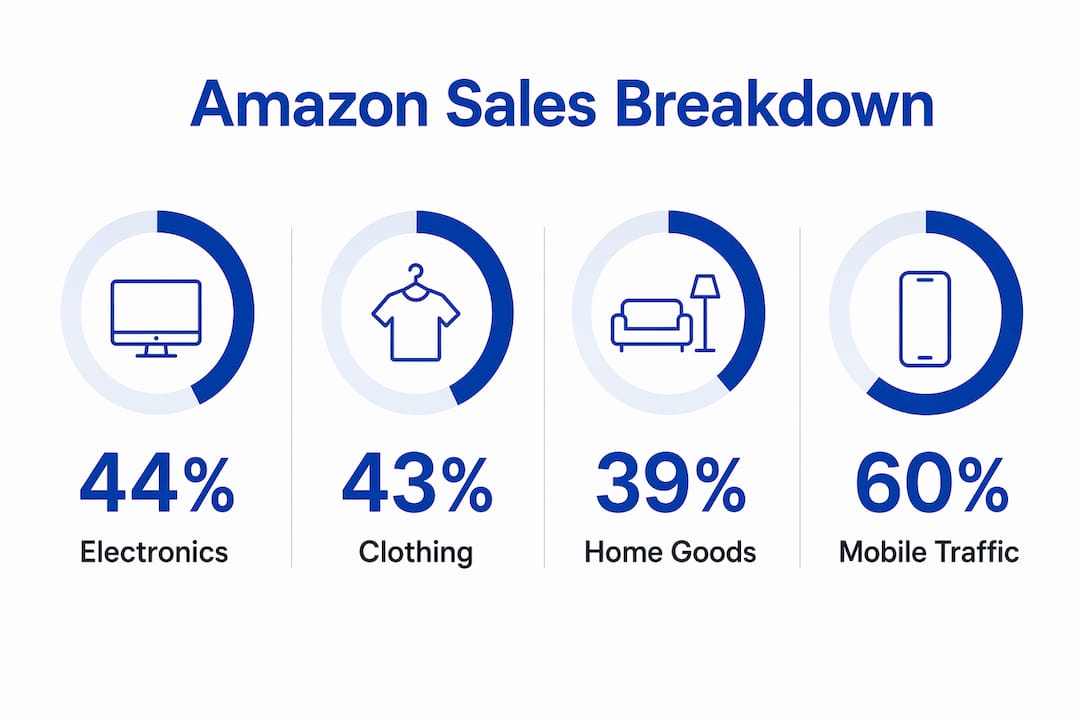
Product category dominance on Amazon follows a clear pattern. Electronics lead at 44% of sales, followed by clothing and shoes at 43%, and home goods at 39%. These three categories capture the majority of high-volume transactions, especially during promotions and holiday periods. Sellers in adjacent categories can use this data to time promotions and bundle products with top-performing categories.
Search behavior is the most underrated buying signal on Amazon. Over 60% of U.S. online shoppers start their product search on Amazon, bypassing Google entirely. That makes Amazon’s search results the primary battleground for visibility. Customer reviews function as the single most powerful conversion trigger. A product with 500 reviews at 4.5 stars will consistently outsell a product with 50 reviews at 4.8 stars, because volume of social proof outweighs perfection.
Mobile behavior adds another layer of complexity. More than 60% of Amazon’s global traffic comes from mobile devices, with emerging markets like India reaching 69.64% mobile usage. Mobile shoppers scan faster, read less, and make decisions based on the first image, the price, and the star rating. Desktop shoppers read more and compare more carefully.
Key buying behavior patterns sellers need to know:
- Convenience drives repeat purchases. Shoppers who use Subscribe & Save rarely comparison shop. They default to the same product unless quality drops.
- Price promotions spike traffic. Lightning Deals and coupons generate short-term volume but attract deal seekers, not loyal customers.
- Reviews are the conversion engine. Products with strong review velocity rank higher and convert faster.
- Mobile-first presentation wins. Listings optimized for mobile, with short titles, clear hero images, and scannable bullet points, outperform desktop-heavy designs.
- Seasonal timing amplifies category trends. Electronics peak in Q4. Home goods spike in spring. Clothing surges during back-to-school periods.
How can sellers effectively reach Amazon’s customer segments?
Precise targeting is the fastest way to reduce wasted ad spend and increase conversion rates. Using Amazon Brand Analytics to refine targeting can reduce customer acquisition costs by up to 50%, with conversion rates running two to three times higher than untargeted campaigns. That is not a marginal improvement. It is the difference between a profitable product and a money-losing one.
Here is a practical framework for segment-specific targeting:
- Identify your primary segment. Use Amazon Brand Analytics to review which demographics and purchase patterns dominate your category. Look at age, income proxy data, and repeat purchase rates.
- Tailor your listing to the segment’s motivation. Prime loyalists respond to quality signals: premium images, brand story, and fast shipping badges. Deal seekers respond to price anchoring, strikethrough pricing, and coupon visibility.
- Optimize for mobile first. Keep titles under 80 characters. Lead with the most important keyword and benefit. Use the first bullet point to state the primary use case in plain language.
- Align ad targeting with behavioral data. Use Sponsored Products campaigns with tight keyword targeting based on actual search term reports. Eliminate broad match terms that attract deal seekers when your product is priced for Prime loyalists.
- Build for lifetime value, not one-time sales. For household and consumable products, push Subscribe & Save enrollment. Families with children have significantly higher lifetime value than one-time buyers, and subscription enrollment locks in repeat revenue.
Pro Tip: Run separate Sponsored Brand campaigns for Prime loyalists and deal seekers. Use lifestyle imagery and brand messaging for the first group. Use price-focused creative and coupon callouts for the second. Tracking CTR and CVR separately for each campaign reveals which segment is actually buying your product.
Sellers who optimize Amazon product visibility with segment-specific keyword strategies consistently outperform those using generic, broad-match approaches. The A10 algorithm rewards relevance and conversion rate. Targeting the right segment improves both.
Key takeaways
Amazon’s target market rewards sellers who segment precisely: Prime loyalists, deal seekers, and tech-forward shoppers each require distinct messaging, pricing, and listing strategies to convert effectively.
| Point | Details |
|---|---|
| Core demographic is 25–54 | Millennials and Gen X drive the highest purchase frequency and Prime membership rates. |
| Prime loyalists are your best customers | They make up 39% of shoppers and prioritize convenience over price, making them high-lifetime-value buyers. |
| Mobile-first listings win | Over 60% of Amazon traffic is mobile, so short titles and strong hero images are non-negotiable. |
| Top categories are electronics, clothing, and home goods | These three categories dominate sales volume, especially during promotions and seasonal peaks. |
| Brand Analytics cuts acquisition costs | Precise behavioral targeting reduces customer acquisition costs by up to 50% compared to broad campaigns. |
What I’ve learned about Amazon segmentation that most guides miss
Most articles on Amazon’s shopper base treat segmentation as a one-time exercise. You identify your audience, write your listing, and move on. That approach misses the most important truth about Amazon’s market: it shifts constantly, and the sellers who win are the ones who treat segmentation as an ongoing process, not a launch checklist.
The biggest mistake I see sellers make is conflating Prime loyalists with deal seekers because both groups are active buyers. They are not the same customer. A Prime loyalist who buys your $45 supplement on a Tuesday morning without a coupon is a completely different person from the shopper who adds your product to their cart during a Lightning Deal and removes it when the deal ends. Pricing for one group while messaging to the other is a fast way to confuse your listing’s conversion signal and hurt your organic rank.
Post-pandemic shopping behavior has also shifted the psychographic map in ways that matter. Convenience has become a baseline expectation, not a premium feature. Shoppers who previously tolerated two-day shipping now expect same-day options. This raises the floor for what “good enough” looks like, and it means that listings which do not clearly communicate speed and reliability are losing Prime loyalists to competitors who do.
The other underused insight is the household-with-children segment. Parents using Subscribe & Save are among the highest-lifetime-value customers on the platform. Yet most sellers treat them as generic repeat buyers rather than a distinct segment worth targeting with specific bundle offers, subscription discounts, and family-sized SKUs. Targeting this group with subscription-focused listing strategies consistently outperforms generic campaigns in categories like household goods, baby products, and food.
The data is there. Amazon Brand Analytics gives you purchase frequency, demographic proxies, and search term data that most sellers never fully use. The sellers who read that data monthly and adjust their listings accordingly are the ones who compound their advantage over time.
— Goga
Searchoneers can help you reach the right Amazon shoppers
Understanding Amazon’s shopper segments is only half the equation. The other half is building listings that speak directly to those segments and rank where your buyers are searching.

Searchoneers specializes in Amazon listing enhancement that aligns your titles, bullet points, and backend keywords with the specific segments driving sales in your category. Whether you are targeting Prime loyalists with quality-focused copy or deal seekers with promotion-ready listings, Searchoneers builds the structure that converts. The team also provides data-driven SEO optimization that tracks performance against real shopper behavior, so your listings stay relevant as the market evolves. If you are ready to match your product to the right buyer, Searchoneers has the tools and expertise to get you there.
FAQ
Who is Amazon’s primary target market?
Amazon’s primary target market is adults aged 25–54, with millennials forming the most active buying group. Higher-income households earning above $100,000 annually show the strongest Prime membership rates, exceeding 70% U.S. penetration.
What are the main behavioral segments on Amazon?
The main behavioral segments are Prime loyalists, deal seekers, tech-forward early adopters, and Subscribe & Save users. Prime loyalists make up about 39% of shoppers and prioritize convenience over price, while deal seekers respond primarily to promotions and discounts.
Which product categories sell best on Amazon?
Electronics lead Amazon sales at 44%, followed by clothing and shoes at 43%, and home goods at 39%. These categories perform especially well during promotional events and holiday seasons.
How does mobile usage affect Amazon buying behavior?
Mobile devices account for over 60% of Amazon’s global traffic, which means listings with short titles, strong hero images, and scannable bullet points convert significantly better than desktop-heavy designs.
How can sellers use Amazon data to improve targeting?
Amazon Brand Analytics provides demographic proxies, search term reports, and purchase frequency data that sellers can use to identify micro-segments. Precise behavioral targeting based on this data can reduce customer acquisition costs by up to 50%.

Comments
One response to “Amazon Target Market: Segments and Strategies for 2026”
[…] a deeper look at how Prime behavior shapes seller strategy, the Amazon segments and strategies guide from Searchoneers breaks down each cohort with practical targeting […]