

TL;DR:
- An Amazon seller calculator estimates all fees, costs, and profits for a product before listing it. It is essential to use ASIN lookup data and include manual inputs like advertising, returns, and prep costs to get accurate profit margins. Combining calculator results with strategic listing optimization helps sellers maximize profitability and avoid common overlooked expenses.
An Amazon calculator for seller is a tool that estimates every fee, cost, and profit tied to a product before you list it. The standard industry term is the FBA Revenue Calculator, available directly inside Amazon Seller Central. Knowing your numbers before launch separates profitable sellers from those who discover their margins after it’s too late. This guide covers how to use both Amazon’s native tool and advanced approaches, what inputs you need, which costs most sellers miss, and how to turn those numbers into smarter pricing and inventory decisions.
What does an Amazon seller calculator actually require?
Getting accurate results from any Amazon fee calculator starts with having the right data ready. The native FBA Revenue Calculator lives inside Amazon Seller Central, and the fastest way to pull accurate product data is to search by ASIN. Using an ASIN retrieves exact product dimensions and weight directly from Amazon’s catalog, which feeds the correct fulfillment fee tier automatically.
The core inputs every seller needs are:
- Selling price — the price you plan to charge buyers
- ASIN or product dimensions — used to calculate size and weight tiers
- Cost of goods sold (COGS) — your per-unit purchase or manufacturing cost
- Inbound shipping cost — what it costs to get inventory to an Amazon fulfillment center
- Prep and labeling fees — third-party prep center costs or your own labor
Advanced third-party calculators go further. They add fields for advertising spend, return rates, storage duration, and risk factors. The table below shows how native and advanced tools differ in what they ask for.
| Input category | Native FBA Revenue Calculator | Advanced third-party calculator |
|---|---|---|
| Referral fee | Yes (live data) | Yes |
| Fulfillment fee | Yes (live data) | Yes |
| Storage fees | Basic estimate | Monthly and long-term |
| Advertising spend | No | Yes |
| Return rate | No | Yes |
| Prep and inbound shipping | Manual entry | Manual or auto-estimated |
| Risk factors (gating, Hazmat) | No | Some tools include this |
Amazon fee math includes category referral fees, fulfillment fees based on size and weight, media closing fees, and fuel surcharges. That complexity is exactly why manual calculations fail so often. A calculator pulling live data removes most of that guesswork.
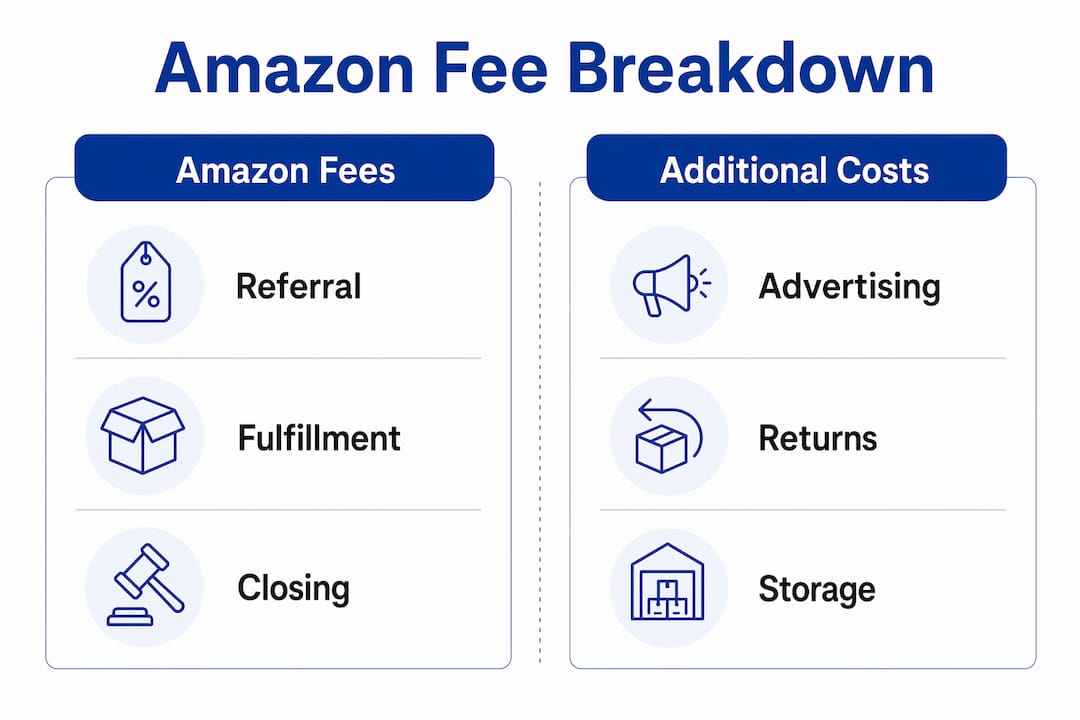
How to calculate fees and profit with Amazon’s FBA Revenue Calculator
The FBA Revenue Calculator is the most reliable starting point because it pulls live, account-specific fee data directly from Amazon. Follow these steps to get a clean profit estimate.
- Open the FBA Revenue Calculator. Log into Amazon Seller Central and search for “Revenue Calculator” in the help menu, or access it through the product listing page for an existing ASIN.
- Search by ASIN. Type the ASIN of the product you want to analyze. This pulls the correct product category, dimensions, and weight automatically.
- Enter your selling price. Start with your target retail price. You will run multiple scenarios, so pick a realistic launch price first.
- Input your cost of goods sold. Enter the per-unit cost you pay to source or manufacture the product.
- Add your shipment and prep costs. Include inbound shipping per unit and any prep or labeling fees. These are manual entries the calculator does not auto-fill.
- Review the output. The calculator shows your estimated referral fee, fulfillment fee, and net profit per unit.
- Model multiple price points. Run the same product at your floor price (lowest you can sell without losing money), your launch price, and your target long-term price.
Using ASINs for dimensional data avoids manual input errors that can cost $1.50 or more per unit in miscalculated fulfillment fees. That error compounds fast across hundreds of units.
One critical gap: the native tool does not include advertising spend, return rates, or prep costs beyond what you enter manually. You get accurate Amazon fees, but not a complete picture of your true per-unit profit.

Pro Tip: Run your analysis at three price points: floor price, launch price, and target price. This shows you exactly how much room you have to run promotions or absorb ad costs without going negative.
What hidden costs do Amazon calculators miss?
The native FBA Revenue Calculator covers Amazon’s official fees accurately. It does not cover the costs that eat into real-world margins. Hidden costs like returns, inbound shipping, prep, and advertising significantly affect margins beyond what the calculator outputs.
Here are the fees sellers most commonly overlook:
- PPC advertising spend — new product launches typically allocate 15–25% of revenue to pay-per-click ads, which directly reduces per-unit profit
- Return processing fees — Amazon charges a fee to process returns, and the returned unit often cannot be resold as new
- Long-term storage fees — inventory sitting in fulfillment centers beyond 365 days incurs significant monthly surcharges
- Inbound freight costs — shipping pallets or boxes to Amazon’s warehouses adds per-unit cost that varies by carrier and distance
- Prep center fees — if you use a third-party prep center, expect $0.50–$2.00 per unit depending on services
- Category gating and compliance costs — some categories require approval fees, testing, or certifications before you can sell
Break-even ACOS (Advertising Cost of Sale) is the metric that ties advertising spend to profitability. Break-even ACOS is calculated as (net profit before ads ÷ sale price) × 100. If your break-even ACOS is 18%, any ad campaign spending more than 18% of revenue on clicks is losing you money. Understanding this number before launch lets you set hard limits on your ad budget.
Standard fee-only calculators miss business risks such as category gating and IP issues, leading to incomplete product viability assessments. A product that looks profitable on paper can become non-viable if it requires expensive compliance steps or faces intellectual property restrictions.
Pro Tip: Always add a 10–15% buffer to your total cost estimate. Unexpected fees, shipping delays, and return spikes happen. A buffer keeps you profitable when they do.
Common mistakes when using Amazon calculators
Most sellers make the same errors when running their numbers. Catching these early saves real money.
- Using list price instead of landed cost. Your landed cost includes COGS, inbound shipping, and prep fees. Sellers who only enter their purchase price underestimate costs and overestimate profit.
- Ignoring advertising spend entirely. A product showing $4.00 net profit per unit after fees looks great until you spend $3.50 per unit on PPC to get it ranked. Always include a realistic ad cost estimate.
- Entering dimensions manually. Manual dimension entry is a common source of fulfillment fee errors. Always use the ASIN lookup to pull verified dimensions from Amazon’s catalog.
- Modeling only one price point. Sellers who calculate profit at a single price have no idea how much flexibility they have. Running three scenarios (floor, launch, target) reveals your true operating range.
- Skipping break-even ACOS. Without knowing your break-even advertising threshold, you have no basis for setting campaign budgets. You end up spending on ads until the account runs dry.
- Ignoring seasonal storage spikes. Amazon raises storage fees during Q4. A product with acceptable storage costs in July can become a margin drain by november if inventory sits unsold.
Each of these mistakes is avoidable. The fix is consistent: use the ASIN lookup, model multiple scenarios, and always include advertising and storage in your cost stack.
How to use calculator results to set prices and plan inventory
Calculator outputs are only useful if you act on them. The goal is a net profit margin of 20–30% after all fees and advertising. That benchmark is what healthy private label sellers target.
Start by identifying your minimum viable price. This is the floor price where your net margin hits 20% after COGS, Amazon fees, prep, shipping, and a realistic ad spend. Any price below that floor means you are subsidizing Amazon’s growth, not your own.
Use your break-even ACOS to cap your advertising budget. If your break-even ACOS is 22%, set your campaign target ACOS at 18–20% to maintain a safety margin. You can calculate your break-even ROAS using tools like the break-even ROAS calculator to cross-check your ad math from a different angle.
The table below shows how different price points affect profit and ad headroom for a hypothetical product with $8.00 COGS and $3.50 in total Amazon fees.
| Selling price | Total fees + COGS | Net before ads | 20% ad spend | Net profit | Viable? |
|---|---|---|---|---|---|
| $18.00 | $11.50 | $6.50 | $3.60 | $2.90 | Marginal |
| $22.00 | $11.50 | $10.50 | $4.40 | $6.10 | Yes |
| $26.00 | $11.50 | $14.50 | $5.20 | $9.30 | Strong |
Inventory planning follows the same logic. If your margin is thin at your launch price, you need faster inventory turns to hit your revenue targets. A product with strong margins at $26.00 gives you room to hold more stock without pressure. Use your inventory cost forecasts alongside calculator outputs to plan reorder quantities that match your cash flow.
Pair your calculator data with your Amazon advertising fees analysis to build a complete picture of per-unit economics before you commit to a product or a price.
Key Takeaways
The most effective way to protect Amazon profit margins is to combine the native FBA Revenue Calculator with manual inputs for advertising, returns, and prep costs before committing to any product or price.
| Point | Details |
|---|---|
| Use ASIN lookup always | Pulling dimensions by ASIN prevents fulfillment fee errors that cost $1.50+ per unit. |
| Include ad spend in your model | New launches spend 15–25% of revenue on PPC, which must be factored into true profit. |
| Know your break-even ACOS | Calculate (net profit before ads ÷ sale price) × 100 to set hard ad budget limits. |
| Target 20–30% net margin | Healthy Amazon sellers aim for this range after all fees and advertising costs. |
| Model three price scenarios | Run floor, launch, and target prices to understand your full operating range. |
Why calculators are only half the equation
I’ve worked with sellers who run their numbers perfectly and still launch products that fail. The calculator said yes. The market said no. That gap is the part no tool fills automatically.
The math is necessary. It is not sufficient. A product can clear a 25% margin on paper and still struggle if the listing is weak, the images are poor, or the keywords are wrong. Buyers never see your cost model. They see your title, your photos, and your reviews. If those elements do not convert, your fee math is irrelevant.
What I’ve found works is treating the calculator as a filter, not a green light. If a product fails the margin test, you cut it immediately. If it passes, you move to the next question: can you build a listing strong enough to compete at that price? That second question requires a completely different set of skills.
Revisit your calculator inputs every quarter. Amazon adjusts fees regularly, and a product that was profitable in january may not be in july after a fee change or a storage rate increase. Sellers who set their numbers once and forget them get surprised. Sellers who check regularly stay ahead.
The most underrated use of calculator data is not product selection. It is pricing discipline. When you know your floor price with precision, you stop chasing competitors into unprofitable territory. You hold your price because you know exactly what breaking that floor costs you.
— Goga
Searchoneers can help you turn profit data into listing performance
Knowing your margins is step one. Turning that data into a listing that actually sells is where most sellers leave money on the table.

Searchoneers specializes in Amazon listing optimization that connects your pricing strategy to your visibility. When you know your target margin, you can build titles, bullet points, and backend keywords that attract the right buyers at the right price point. That alignment between fee math and listing quality is what separates sellers who scale from those who stall. Explore the listing optimization workflow Searchoneers uses to help sellers convert calculator insights into real sales growth.
FAQ
What is the Amazon FBA Revenue Calculator?
The Amazon FBA Revenue Calculator is a free tool inside Amazon Seller Central that estimates referral fees, fulfillment fees, and net profit per unit using live fee data. It does not include advertising spend or return costs, which sellers must add manually.
How do I find my break-even ACOS?
Divide your net profit before advertising by your selling price, then multiply by 100. If your net profit before ads is $5.00 on a $25.00 item, your break-even ACOS is 20%.
What net profit margin should Amazon sellers target?
Healthy Amazon sellers target a net profit margin of 20–30% after all fees and advertising costs. Margins below 15% leave little room to absorb fee changes or ad spend increases.
Why does the native calculator miss some fees?
The native FBA Revenue Calculator provides accurate Amazon fee data but excludes advertising spend, return processing fees, prep costs, and long-term storage surcharges. Sellers must add these manually for a complete profit model.
Should I use an ASIN or enter dimensions manually?
Always use the ASIN lookup. Manual dimension entry is a common source of fulfillment fee miscalculations that can cost $1.50 or more per unit. The ASIN pulls verified data directly from Amazon’s catalog.

Comments
2 responses to “Amazon Calculator for Seller: Master Fees and Profit”
[…] before sourcing. Build a full fee stack for every product before you commit to inventory. Use a fee calculation tool to estimate referral, fulfillment, storage, subscription, and advertising costs […]
[…] Searchoneers […]