
Many Amazon sellers believe bestseller rank directly reflects search visibility or overall popularity, but this common misconception can derail optimization efforts. Bestseller rank (BSR) actually measures sales performance relative to competitors within specific categories, not search position or total market share. Understanding this distinction is crucial for sellers who want to interpret rank fluctuations accurately and make data-driven decisions. This guide unpacks BSR mechanics, recent 2026 updates, and actionable strategies to help you leverage this metric for improved product performance and sales growth on Amazon’s competitive marketplace.
Table of Contents
- What Is Amazon Bestseller Rank And How Is It Calculated?
- Nuances And Recent Updates To Bestseller Rank In 2026
- Interpreting Bestseller Rank Benchmarks And Common Seller Pitfalls
- How Sellers Can Use Bestseller Rank To Boost Product Performance
- Boost Your Amazon Sales With Expert Listing Optimization
- Frequently Asked Questions
Key takeaways
| Point | Details |
|---|---|
| BSR measures relative sales | It ranks products by recent sales performance within specific categories, not total popularity. |
| Updated hourly with recency bias | Amazon refreshes BSR every hour, heavily weighting sales from the last 24 to 72 hours. |
| Stockouts trigger penalties | Inventory gaps over 2 hours cause rank decay with penalties lasting up to 72 hours. |
| BSR differs from search rank | Sales rank and A9 search algorithms operate independently, though high sales can indirectly boost visibility. |
| Use BSR for benchmarking | Sellers leverage BSR to validate demand, track competitors, and gauge category performance potential. |
What is Amazon bestseller rank and how is it calculated?
Amazon Best Sellers Rank appears under product information on every detail page, displaying a numerical position that orders products by sales relative to others in their category or subcategory. Lower numbers indicate stronger sales performance, with #1 representing the top seller in that category at the moment. This metric is entirely sales-based and category-specific, meaning a single product can hold different ranks across multiple categories simultaneously.
Amazon updates BSR hourly based on sales data, with the formula emphasizing recent transactions over historical totals. A product that sold 50 units yesterday and 5 today will likely rank lower than one that sold 20 yesterday and 30 today, even though the first has higher cumulative sales. This recency weighting creates dynamic rank fluctuations that reflect current market momentum rather than lifetime performance.
The calculation mechanics prioritize three core elements:
- Sales volume within the last 24 to 72 hours carries the heaviest weight
- Historical sales data influences rank but diminishes rapidly over time
- Category context determines competitive benchmarks, so a #500 rank in Toys differs dramatically from #500 in Industrial Supplies
Sellers often track BSR using tools like our best seller rank tracker guide to monitor performance trends and identify optimization opportunities. Understanding these mechanics helps you interpret rank changes accurately rather than reacting to normal hourly volatility.
Amazon’s BSR system creates a relative performance ladder where your position depends entirely on how your recent sales compare to competitors in the same category, not absolute sales numbers or profitability metrics.
This category-specific nature means strategic sellers can improve their visible rank by selecting more targeted subcategories where competition is lighter, a tactic explored in our rank higher on Amazon guide. The key insight is that BSR reflects competitive positioning within a defined market segment, not universal popularity across Amazon’s entire catalog.
Nuances and recent updates to bestseller rank in 2026
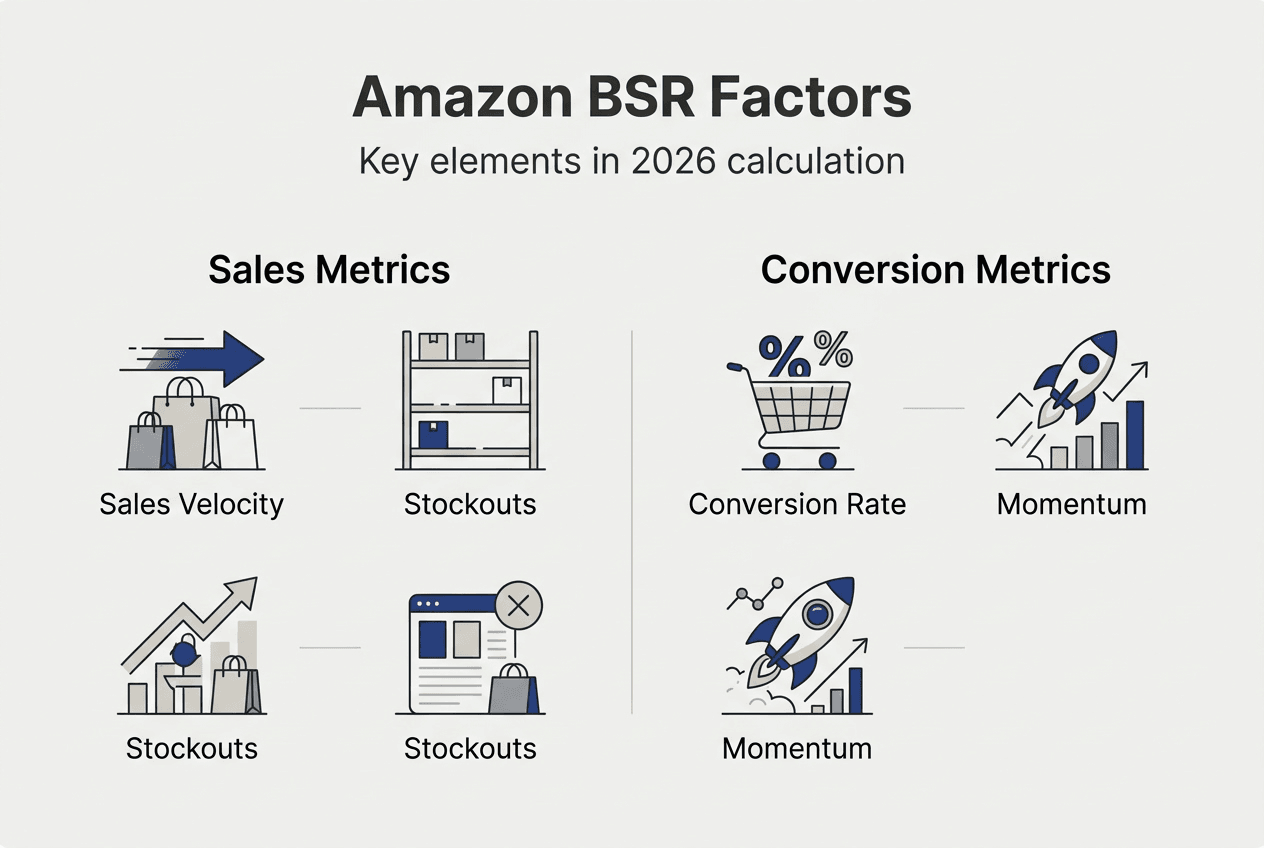
Amazon introduced significant BSR calculation refinements in 2026 that move beyond simple sales volume to incorporate inventory stability, conversion health, and velocity normalization. These multi-factor updates reward consistent availability and strong buyer engagement while penalizing operational gaps that disrupt customer experience.

The Inventory Stability Score now penalizes stockouts lasting over 2 hours, applying immediate rank decay that persists for 72 hours after inventory restoration. Initial stockouts trigger 12 to 18% rank penalties, while repeated outages within 30 days escalate penalties up to 22%. This mechanism pushes sellers to maintain buffer inventory and monitor stock levels proactively, as even brief gaps can erase weeks of rank-building effort.
Conversion Health Factor links click-through rates to purchase completion, rewarding listings that convert browsers into buyers efficiently. Products with strong CTR-to-purchase ratios receive subtle rank boosts, while those with high traffic but low conversion face drag effects. This factor incentivizes listing optimization beyond just driving traffic, emphasizing the quality of your product presentation and pricing competitiveness.
Sales Velocity Normalization compares your current sales pace to 30-day category averages, identifying momentum shifts that signal growing or declining demand. Products exceeding 3.2 times their category’s median velocity receive accelerated rank improvement, while those falling below 0.6 times median face steeper decay. This normalization prevents seasonal spikes from permanently distorting ranks while highlighting genuine breakout performers.
| Factor | Impact on BSR | Threshold |
|---|---|---|
| Inventory Stability Score | 12 to 18% penalty for first stockout | Outages over 2 hours |
| Repeated Stockouts | Up to 22% enhanced penalty | Multiple gaps in 30 days |
| Sales Velocity Spike | Accelerated rank improvement | Over 3.2x category median |
| Conversion Health Factor | Subtle boost or drag effect | CTR-to-purchase ratio vs peers |
Pro Tip: Monitor your Inventory Performance Index in Seller Central weekly to catch potential stockout risks before they trigger BSR penalties. Set reorder points at 14 days of cover rather than waiting until 7 days to build safety margins against supplier delays.
These 2026 updates make BSR a more sophisticated performance metric that rewards operational excellence alongside sales volume. Sellers who maintain consistent inventory through our optimize Amazon inventory listings strategies gain compounding advantages as competitors struggle with penalty cycles. The system now measures not just what you sell, but how reliably and effectively you deliver that inventory to buyers.
Interpreting bestseller rank benchmarks and common seller pitfalls
Category benchmarks provide essential context for evaluating whether your BSR represents strong, average, or weak performance within your niche. Top 1% products in Toys & Games typically hold median BSRs around 5, while Electronics top performers average around 8, reflecting vastly different competitive densities and sales volumes across categories.
BSR volatility indexes vary dramatically by category characteristics. Toys & Games experiences high volatility due to seasonal demand swings and trend-driven purchases, while Office Products maintains relatively stable ranks because of consistent replenishment buying patterns. Understanding your category’s typical volatility helps you distinguish meaningful rank changes from normal fluctuations that require no action.
Common seller pitfalls sabotage BSR performance even when products have strong market potential:
- Stockouts cause persistent penalties that compound with each repeated outage, creating downward spirals
- Selecting overly broad categories dilutes your competitive position, making top ranks nearly impossible to achieve
- Confusing BSR with A9 search rank leads to misguided optimization efforts that target the wrong metrics
- Ignoring subcategory opportunities leaves easier ranking paths unexplored
BSR measures sales velocity, not profitability or search visibility. A product ranked #100 in a high-volume category might generate more revenue than a #10 product in a tiny niche, while both could rank poorly in search results if their listings lack keyword optimization. This disconnect confuses sellers who assume strong BSR automatically translates to high organic visibility or profit margins.
| Category | Top 1% Median BSR | Volatility Index | Competitive Density |
|---|---|---|---|
| Toys & Games | ~5 | High | Very High |
| Electronics | ~8 | Medium-High | High |
| Office Products | ~12 | Low | Medium |
| Home & Kitchen | ~15 | Medium | High |
Choosing the most specific relevant subcategory dramatically improves your relative rank potential. A kitchen gadget competing in the broad Home & Kitchen category might struggle to break into the top 5,000, but the same product in the narrower Garlic Presses subcategory could easily rank in the top 50. This strategic categorization creates better BSR visibility without changing your actual sales volume.
Pro Tip: Research your top 3 competitors’ category selections using tools like Jungle Scout or Helium 10 to identify subcategories where strong sellers concentrate. If multiple successful products cluster in a specific subcategory, that signals an optimal competitive positioning choice.
Sellers who master BSR interpretation through our optimize Amazon inventory listings and Amazon selling tips resources gain advantages in product research, inventory planning, and competitive analysis. The metric becomes a strategic tool rather than a vanity number when you understand its limitations and apply category-specific benchmarks to your decision-making process.
How sellers can use bestseller rank to boost product performance
Monitoring BSR regularly reveals sales trends and competitive movements that inform inventory decisions and marketing timing. Daily rank tracking identifies when competitors launch promotions or experience stockouts, creating temporary opportunities to capture displaced demand. Weekly trend analysis spots gradual rank improvements or declines that signal whether your current strategies are working or need adjustment.
Avoiding stockouts protects your rank from the 12 to 22% penalties introduced in 2026, but also preserves the momentum you’ve built through previous sales. Each stockout resets your velocity metrics and forces you to rebuild rank from a penalized starting point, wasting weeks of optimization effort. Maintaining 14 to 21 days of inventory cover prevents most stockout scenarios while accommodating supplier variability.
Choosing the most relevant, less competitive subcategories improves your relative rank without requiring additional sales volume. Strategic category selection follows this process:
- Identify all eligible categories and subcategories where your product legitimately fits Amazon’s guidelines
- Research current top 100 BSRs in each option to assess competitive density and sales requirements
- Select the most specific subcategory that accurately describes your product and shows achievable rank targets
- Monitor performance for 30 days, then test alternative categorizations if results disappoint
Using BSR alongside Amazon SEO strategies creates holistic optimization that addresses both sales velocity and search visibility. Strong BSR indicates healthy sales momentum, but without proper keyword optimization through our Amazon SEO optimization basics guide, you miss opportunities to capture organic search traffic that could accelerate rank growth further.
Optimizing listing content improves conversion rates, which directly feeds the Conversion Health Factor introduced in 2026. Enhanced titles, compelling bullet points, and benefit-focused descriptions through our Amazon listing enhancement guide turn more browsers into buyers, creating the high CTR-to-purchase ratios that earn subtle rank boosts under the new algorithm.
Implementing pricing and advertising strategies that drive recent sales velocity leverages BSR’s recency weighting. Promotional campaigns timed to create 3 to 5 day sales spikes can trigger accelerated rank improvement when velocity exceeds 3.2 times your category median. Amazon PPC campaigns, lightning deals, and external traffic pushes all contribute to the concentrated sales bursts that move BSR most effectively.
Pro Tip: Use Seller Central’s Inventory Health dashboard to monitor your Inventory Performance Index and set automated reorder alerts at your calculated reorder point. Pair this with the CTR and conversion rate metrics in your advertising console to track the factors now influencing your BSR beyond just sales volume.
Sellers who apply these strategies through our listing optimization checklist transform BSR from a passive metric into an active growth lever. The combination of inventory discipline, strategic categorization, listing excellence, and velocity-focused promotions creates compounding advantages that competitors struggle to match without similar systematic approaches.
Boost your Amazon sales with expert listing optimization
Understanding bestseller rank mechanics provides the foundation, but translating that knowledge into consistent sales growth requires systematic optimization across your entire Amazon presence. Searchoneers specializes in helping sellers implement the exact strategies covered in this guide through proven workflows and expert analysis tailored to your specific products and categories.
Our Amazon listing enhancement guide walks you through title optimization, bullet point refinement, and description enhancement that improves conversion rates and feeds the Conversion Health Factor now influencing your BSR. These aren’t generic templates but category-specific frameworks that address the unique buyer psychology in your market segment.

The listing optimization workflow we’ve developed for sellers combines keyword research, competitive analysis, and conversion optimization into a repeatable process that consistently improves both search visibility and sales velocity. This systematic approach ensures you’re addressing all factors that influence modern BSR calculations, not just chasing short-term rank spikes that fade without sustainable foundations. Pairing these listing improvements with our inventory optimization strategies creates the operational excellence that prevents stockout penalties while maintaining the momentum needed for top-tier BSR performance.
Frequently asked questions
What exactly does Amazon bestseller rank measure?
Bestseller rank measures your product’s recent sales performance relative to all other products in the same category or subcategory. It’s a competitive positioning metric that updates hourly based primarily on sales from the last 24 to 72 hours, with lower numbers indicating stronger sales velocity compared to category peers.
How often is bestseller rank updated on Amazon?
BSR updates occur hourly, with each refresh incorporating the most recent sales data while gradually diminishing the weight of older transactions. This frequent update cycle means short-term fluctuations are completely normal, and you should focus on weekly trends rather than reacting to every hourly change. The hourly refresh ensures BSR reflects current market momentum rather than historical performance.
Does bestseller rank affect my Amazon search ranking?
BSR operates independently from A9 search algorithms, measuring sales performance while search rank evaluates keyword relevance, conversion rates, and customer satisfaction signals. High sales velocity improves both metrics indirectly because strong sales generate positive customer signals that A9 values, but BSR itself is not a direct search ranking factor. You need separate optimization strategies for each system.
How can I improve or maintain a good bestseller rank?
Maintaining consistent inventory prevents the 12 to 22% stockout penalties that cause rapid rank decay. Optimize your listing through our Amazon listing enhancement guide to boost conversion rates and drive the recent sales velocity that BSR weighs most heavily. Focus promotional efforts on creating concentrated sales spikes that exceed 3.2 times your category median to trigger accelerated rank improvement.